Real-world EV efficiency
How EVs really drive.
Efficiency from real drives by PlugLog drivers, by year, make and model, and by the weather, speed and trip length. Not a lab test: the energy their batteries actually used. Shopping for an EV? See how it holds up.
Shared by PlugLog drivers
- drives
- 173
- drives
- EV models
- 14
- EV models
- driven
- 2,036 mi
- driven
Every number comes from a real drive, measured by the car's own battery, and grows as more drivers share.
Showing all shared drives
By vehicle
Real-world range is the EPA range scaled by how the real efficiency compares.
| Vehicle | Drives | Real-world | EPA | vs EPA | Real-world range |
|---|---|---|---|---|---|
| 2024 Chevrolet Silverado EV All-Wheel Drive · 3 drivers · 651 mi | 20 | 2.08 mi/kWh | 1.98 | +5% | 413 mi |
| 2025 GMC Sierra EV 4-Wheel Drive · 2 drivers · 250 mi | 26 | 2.35 mi/kWh | 1.91 | +23% | 480 mi |
| 2026 GMC Sierra EV 20-mod battery, 11kW 15-mode charger 4-Wheel Drive · 1 driver · 234 mi | 21 | 2.33 mi/kWh | 2.02 | +15% | 473 mi |
| 2024 Chevrolet Silverado EV All-Wheel Drive · 1 driver · 202 mi | 12 | 2.24 mi/kWh | 1.87 | +19% | 537 mi |
| 2026 Chevrolet Silverado EV 24-mod battery, 19kW 6-mode charger 4-Wheel Drive · 1 driver · 189 mi | 18 | 2.15 mi/kWh | 2.02 | +6% | 525 mi |
| 2026 Chevrolet Silverado EV 20-mod battery, 19kW 6-mode charger 4-Wheel Drive · 1 driver · 168 mi | 21 | 2.22 mi/kWh | 2.09 | +6% | 451 mi |
| 2026 Chevrolet Equinox EV FWD Front-Wheel Drive · 2 drivers · 72 mi | 11 | 3.62 mi/kWh | 3.22 | +12% | 359 mi |
| 2026 Tesla Model Y Performance AWD All-Wheel Drive · 1 driver · 63 mi | 8 | 3.52 mi/kWh | 3.30 | +7% | 327 mi |
| 2026 Polestar 4 Long Range Dual Motor All-Wheel Drive · 1 driver · 52 mi | 8 | 2.94 mi/kWh | 2.50 | +18% | 330 mi |
| 2024 Cadillac LYRIQ Rear-Wheel Drive · 2 drivers · 51 mi | 11 | 2.70 mi/kWh | 2.63 | +3% | 323 mi |
| 2026 Polestar 4 Long Range Single Motor Rear-Wheel Drive · 1 driver · 39 mi | 2 | 3.55 mi/kWh | 2.86 | +24% | 386 mi |
| 2025 Tesla Model Y Performance AWD All-Wheel Drive · 1 driver · 34 mi | 9 | 3.57 mi/kWh | 3.09 | +16% | 321 mi |
| 2024 Honda Prologue AWD Elite All-Wheel Drive · 1 driver · 19 mi | 3 | 2.98 mi/kWh | 2.72 | +10% | 300 mi |
| 2025 Cadillac LYRIQ AWD (19 kW Charger) All-Wheel Drive · 1 driver · 13 mi | 3 | 3.41 mi/kWh | 2.52 | +36% | 411 mi |
Efficiency by outside temperature
Cold batteries and cabin heat cost range. Here's how much, for these drives.
- 32–50°F1.97 mi/kWh3 drives
- 50–68°F2.34 mi/kWh63 drives
- 68–86°F2.31 mi/kWh72 drives
- Above 86°F2.31 mi/kWh35 drives
Longer bars go further on each kWh.
Efficiency by speed
Air resistance climbs quickly with speed. Here's what it costs, by each drive's average speed.
- Under 20 mph1.87 mi/kWh24 drives
- 20–40 mph2.58 mi/kWh113 drives
- 40–55 mph2.32 mi/kWh26 drives
- 55–70 mph2.10 mi/kWh10 drives
Longer bars go further on each kWh.
Only drives from drivers who chose to share their efficiency data, with no names or locations. Efficiency is distance ÷ the energy each battery reported using, net of regen. How it's measured
How it's measured
Real drives, straight from the battery.
EPA ratings come from a lab cycle. These come from the road: every drive shared by a PlugLog driver, recorded by the car itself.
Measured, not estimated
The PlugLog car app reads your battery's power many times a minute and checks it against the battery level. Efficiency is distance over the energy actually used, net of regen.
Shared on purpose
Drives count only if their driver turned on efficiency sharing, and then all of them do, so no one picks their best. No names, no routes, no locations: just how the EV did.
Every condition
Cold mornings, highway runs, short hops. Filter by the weather, speed and trip length to see the numbers that match how you'd drive.
Track your own EV
Get numbers like these for your car.
PlugLog logs every drive and charge, works out what your EV really gets, and lets you share it to help the next buyer.
- Free
- Android Automotive car app
- Share only what you choose
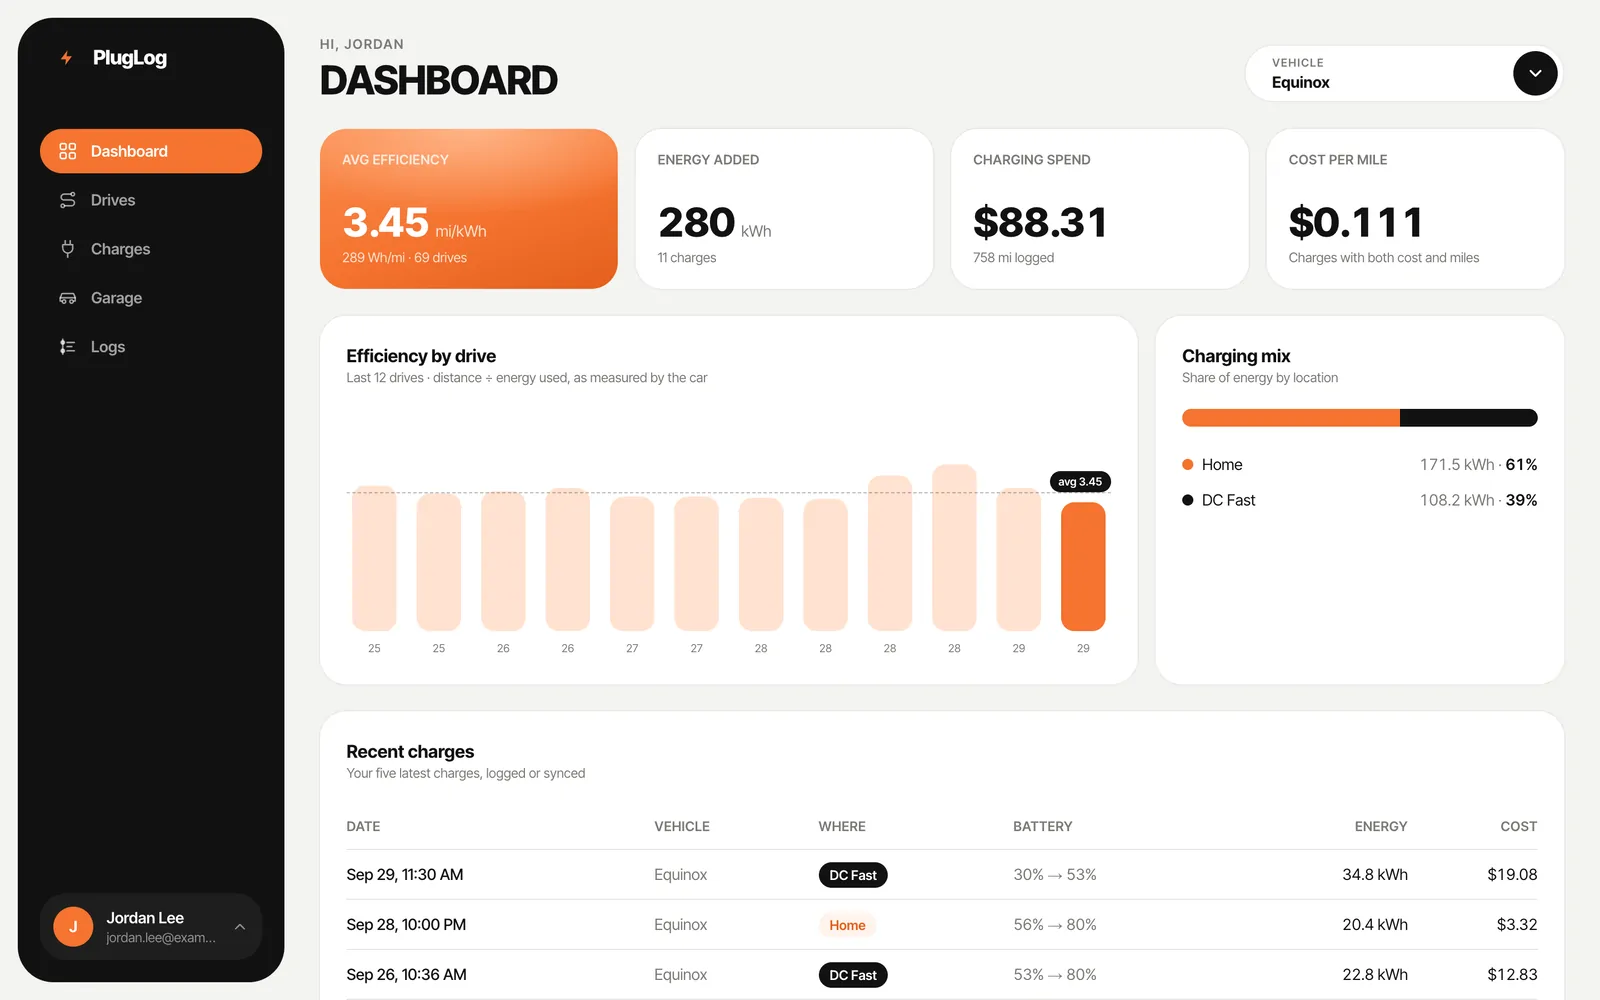
Your EV's dashboard
Your own efficiency, energy added, charging spend and cost per mile, drive by drive.
Live in your car
On Android Automotive, PlugLog records every drive and charge on its own and shows efficiency as you drive. Shown at 9× speed.
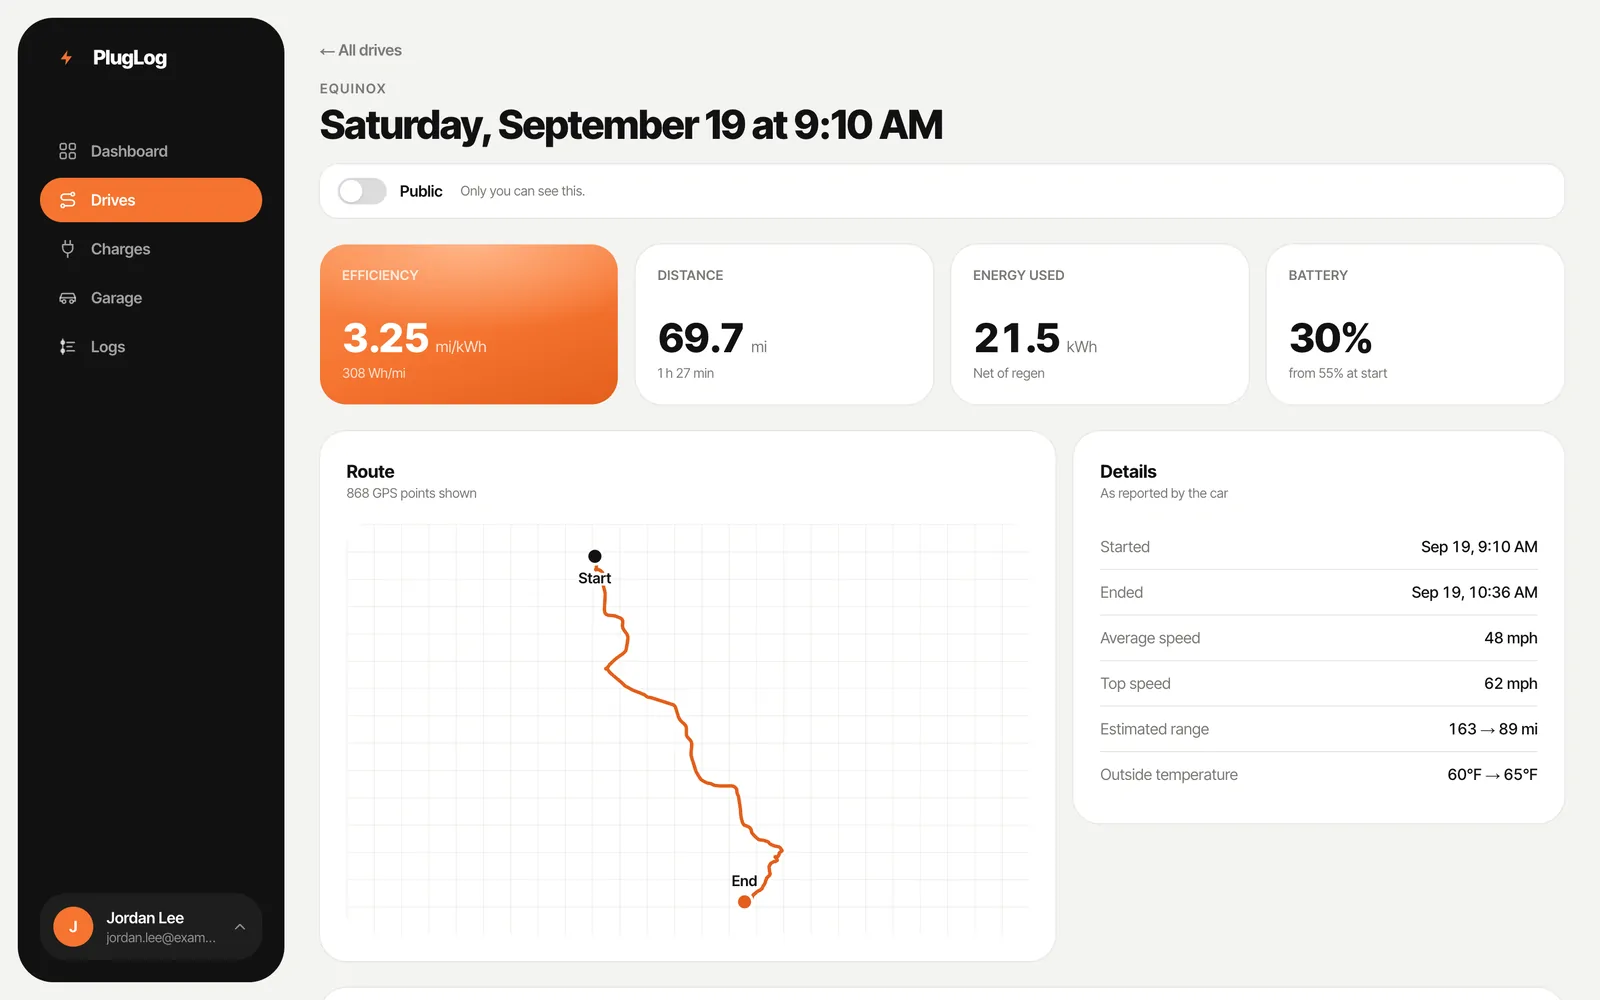
Every drive, second by second
Where the energy went, driving, regen and stopped, with the route, speed and battery level.
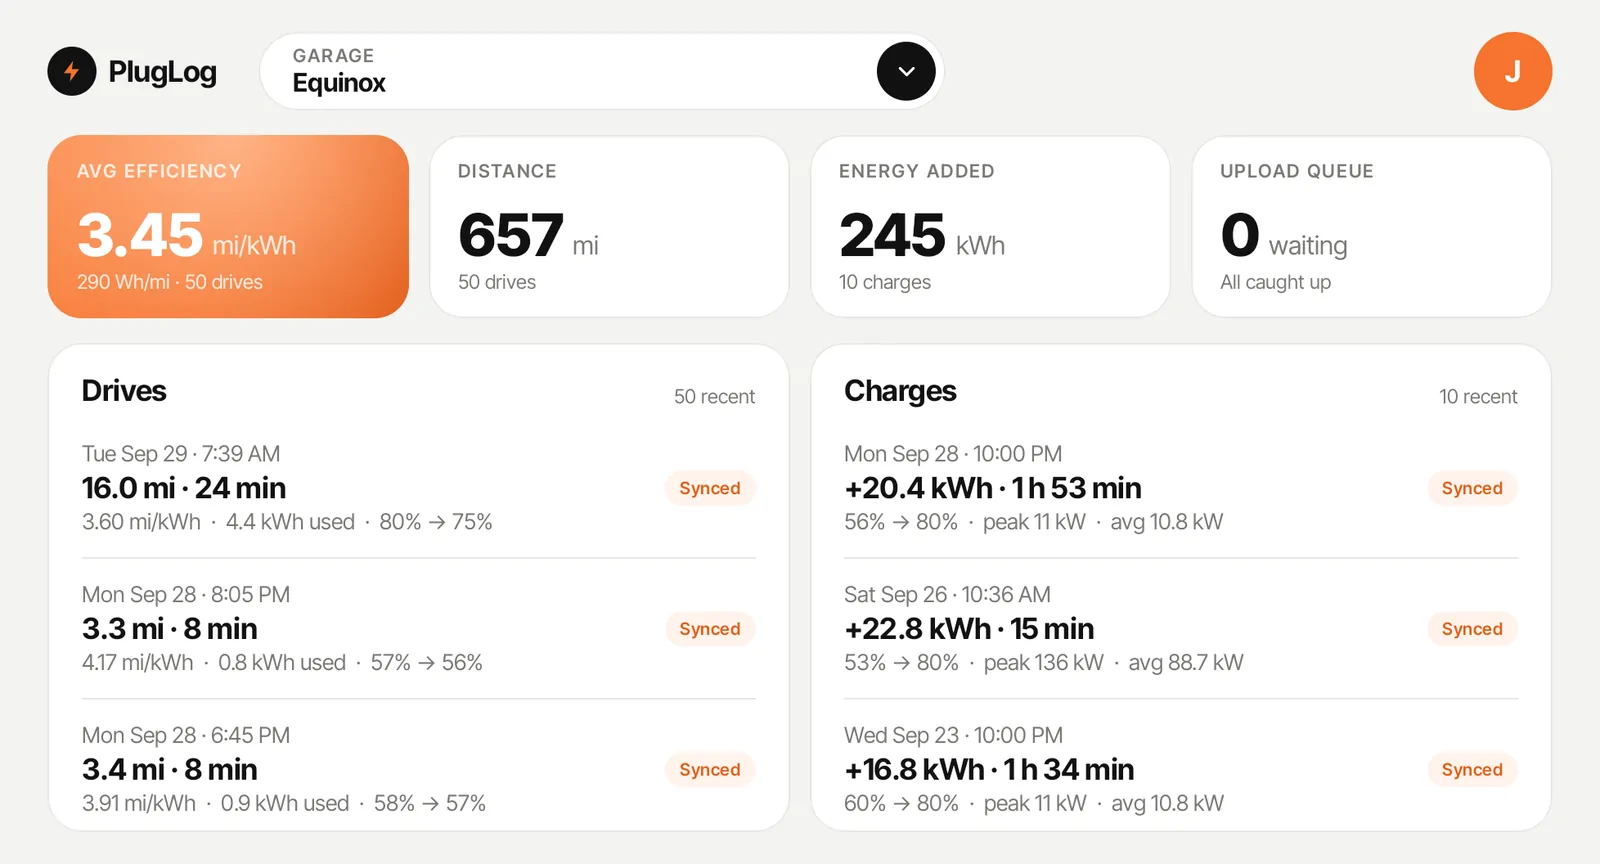
Your EV at a glance
Efficiency, distance and energy added for the car you're in, synced with your account.
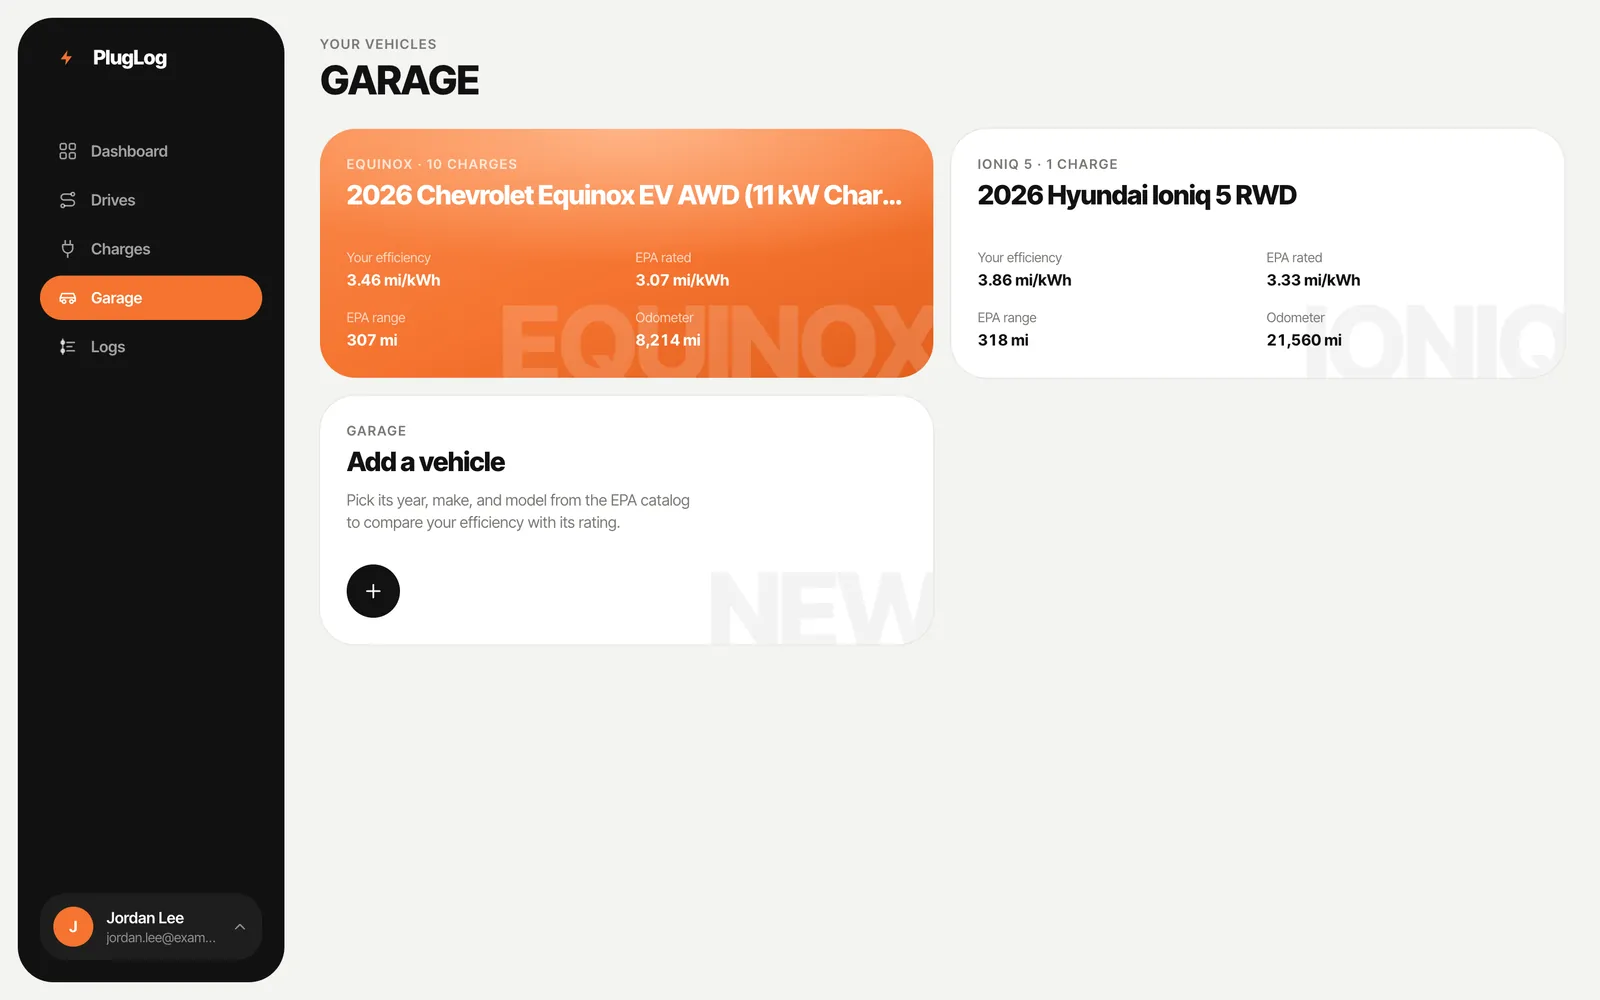
You vs the EPA rating
See how your EV compares with its rating, and share your drives to add to the numbers above.
Your EV belongs on this page.